You open your investment app — it says your portfolio is up +12%.
Feels good… until you check your account balance and it’s barely moved.
What’s going on? Did your app mess up, or is the market lying to you?
The truth is neither.
Your return isn’t wrong — it’s just calculated differently.
That confusion hits almost every investor at some point.
Because there’s not one “real” way to calculate an investment return.
Depending on when you invested, how much you added or sold, and how your app defines “gain,”
the same portfolio can show completely different results.
Let’s break this down — not with theory, but with something you can actually use.
We’ll walk through the four main ways returns are calculated, what each really means,
and how to tell which one matters most for your goals.
Why This Matters
Return on investment looks simple — you buy, you sell, you see profit.
But investing isn’t a single event. It’s a moving story of deposits, withdrawals, dividends, and market swings.
Even if the total profit ends up the same, the path — and the math — can tell very different stories.
Most apps only show one number, often the easiest one.
That’s why two investors holding the same stock can see completely different returns.
John, Joe, Ray, and May all invested in the same asset — but their reports tell four different tales.
We’ll use one consistent dataset to see how those differences play out.
No stock splits, no fees, no taxes — just pure return math.
A Sample Set of Investment Return Calculation Transaction Data
Date | Annual Return on A-Stocks | John – Hold to Maturity | Joe – Buy at the Same Price | Ray – Buy at Different Price | May – Sell at Different Price |
2001/1/1 | 0.00% | $16,000 investment, bought 1600 A shares at $10 | $10,000 investment, bought 1000 A shares at $10 | $10,000 investment, bought 1000 A shares at $10 | $16,000 investment, bought 1600 A shares at $10 |
2002/1/1 | -10.00% (2002) | A stock, price $10 | $6,000 investment, bought 600 A shares at $10 | A stock at $10 | A stock at $10 |
2003/1/1 | 66.67% (2003) | A stock at $9 | A stock at $9 | $5,400 investment, bought 600 A shares at $9 | A stock at $9 |
2004/1/1 | 6.67% (2004) | A stock at $15 | A stock at $15 | A stock at $15 | Sold 900 A shares at $15 total of $13,500 |
2005/1/1 | A stock price is $16, 1600 shares, market value $25,600 | A stock price is $16, 1600 shares, market value $25,600 | A stock price is $16, 1600 shares, market value $25,600 | A stock price is $16, 700 shares, market value $11,200 | |
Total Return | Geometric Cumulative Return | 60.00% | 60.00% | 66.23% | 54.38% |
Unrealized Return | 60.00% | 60.00% | 63.75% | 60.00% | |
Arithmetic Mean Return | 15.00% | 15.00% | 16.56% | 13.60% | |
MWRR | Geometric Mean Return 12.47% | 12.47% | 13.78% | 16.30% | 13.46% |
TWRR | Geometric Mean Return 12.47% | 12.47% | 12.47% | 12.47% | 12.47% |
Explanation of Relevant Fields:
- A Stock Annual Return: (Next Year’s Initial Stock Price – Current Year’s Initial Stock Price) / Current Year’s Initial Stock Price, representing the performance of A stock for the year.
- John: Purchased at the beginning and held until the end.
- Joe: Compared to John, bought at the same price each year and held until the end
- Ray: Compared to John, bought at different prices each year and held until the end.
- May: Compared to John, bought at the same price each year and sold at different prices in different years.
Each of them touched the same stock — A — but their numbers tell a different story.
That’s where the four return methods come in:
- Total Return — simple, overall gain.
- Unrealized Return — how much your current holdings are up.
- Money-Weighted Return (MWRR) — reflects your real behavior and cash flow timing.
- Time-Weighted Return (TWRR) — removes the effect of deposits and withdrawals, ideal for comparing managers or funds.
Understanding these four doesn’t just make you “smarter” —
It helps you see whether your performance is real growth or just a timing illusion.
Total Return
The Total Rate of Return shows your overall gain or loss percentage compared to your total invested amount over the period.
It’s the most straightforward way to measure performance — and also the easiest to misunderstand.
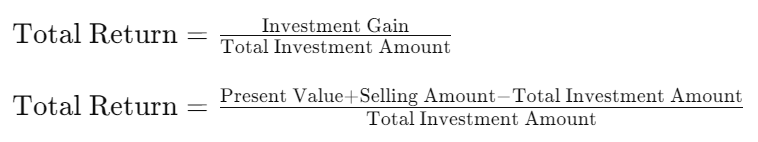
Formula:
Total Return = (Investment Gain ÷ Total Investment Amount)
= (Present Value + Selling Amount − Total Investment Amount) ÷ Total Investment Amount
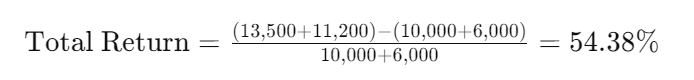
Example:
((13,500 + 11,200) − (10,000 + 6,000)) ÷ (10,000 + 6,000) = 54.38%
Using the values above, we can see that John’s Total Return equals A Stock’s Total Return — he held from start to finish.
Joe’s Total Return also matches John’s, because this method ignores time.
It only looks at where you started and where you ended, not when you invested or how the cash moved in between.
That’s why Total Return can make completely different investing behaviors look identical —
even if the timing, effort, and cash flow were not the same.
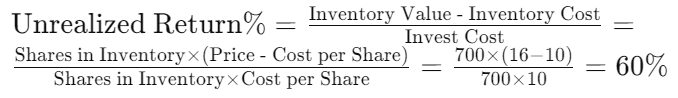
Unrealized Return
The Unrealized Return measures the profit or loss on your unsold holdings — in other words, the gain or loss based on your current market value.
It can be calculated in different ways depending on how you track cost per share: weighted average, FIFO (First-In-First-Out), or moving average.
Example:
Joe’s weighted average cost = (1000 × 10 + 600 × 10) ÷ 1600 = 10.00
Interpretation:
John and May have the same unrealized return rate — meaning that if both sold all their shares right now, they’d get the same percentage return.
But this measure ignores profits that were already realized through dividends or partial sales.
Most financial websites display Unrealized Return in your portfolio list because it’s simple and quick to update.
However, it tells only part of the story — it reflects the current picture of your holdings, not the full performance of your investments.
It also ignores the time value of money, which means it can’t show how effectively your money has really grown over time.
Arithmetic Average Return
The Arithmetic Average Return represents the simple mean of all annual returns.
It’s an easy way to get a quick “average” — but not an accurate one.
It behaves much like Total Return, but it fails to reflect the compounding effect of time.
In this dataset, we can see that Total Return, Unrealized Return, and Arithmetic Average Return all ignore the time value of money.
Example:
Imagine Joe invested $10,000 ten years ago, and now it’s worth $15,000 — that’s a 50% total return.
Ray invested the same $10,000 just one year ago, and it’s also worth $15,000 — same 50%.
If we divide that 50% evenly across ten years, Joe’s average annual return is roughly 5%.
Ray’s one-year gain is 50%.
Arithmetic Average treats them as if they achieved the same “total return,” but clearly, they didn’t.
It completely ignores how long it took to earn that return.
That’s why Arithmetic Average Return works fine for quick comparisons,
but not for understanding real growth.
It can easily overstate or understate what actually happened over time.
Money-Weighted Rate of Return(MWRR)
Now, how do we bring time into the picture?
That’s where the Money-Weighted Rate of Return (MWRR) — also known as the Internal Rate of Return (IRR) — comes in.
Please refer to the Wikipedia page on the Time Value of Money.
MWRR factors in the time value of money by finding the rate that makes the present value of all cash flows — investments, sales, dividends, and the final balance — equal to zero.
In other words, it’s the average rate of return per period that explains all inflows and outflows.
Conceptually:

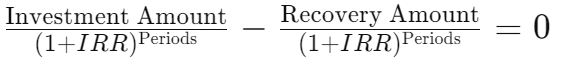
where Investment Amount represents each cash flow at time t (including investments, withdrawals, dividends, and final value).
This method weights each cash flow by when it happens.
Money invested earlier has more impact than money added later — which is why MWRR reflects your actual investing behavior.
If the calculated rate of return per period makes the present value of investment and recovery amounts
(selling amount, dividends, and investment’s present value) equal to zero,
it can be considered as the average rate of return per period during that period.
This is formally defined as the Internal Rate of Return (IRR).
For more details, see the Wikipedia page on Internal Rate of Return.
In our dataset, Joe’s MWRR equals the annual return of A Stock because he invested evenly over time.
John, Ray, and May each have different MWRRs since their timing and actions differed.
MWRR gives a full picture of how your own decisions affected your results.
It’s ideal for personal portfolios or financial goals — situations where cash flow timing matters most.
However, it’s less useful for comparing funds or indices, because investor deposits and redemptions can distort the measurement.
You’ll often see MWRR used for loans, investment programs, or any scenario where money moves over time.
It can also be used to analyze the feasibility of financial goals.
Please refer to the following article for more information:
Money-Weighted Rate of Return – Loan and Investment Programs Selection.
Time-Weighted Rate of Return(TWRR)
What if you want to measure pure investment performance — without being affected by when or how much you invested?
That’s where the Time-Weighted Rate of Return (TWRR) comes in.
TWRR isolates investment performance itself.
It divides your investment period into sub-periods, calculates the return for each one,
and then links those returns geometrically, removing the effects of deposits and withdrawals.
Conceptually:

This way, you see how the underlying investment actually performed — independent of your own cash flow timing.
Example:
In May’s case, her 2004 return is calculated this way:
(Each sub-period return × next sub-period return) − 1 = cumulative rate for the entire period.

From our dataset, the geometric average return of A Stock and the TWRR for John, Joe, Ray, and May are the same.
This proves that TWRR completely removes the influence of timing and investment amount —
it reflects only how the investment itself performed.
If you hold multiple assets, TWRR can measure overall portfolio performance.
It’s also used to calculate risk metrics such as standard deviation, Alpha, Beta, and the Sharpe ratio.
Because it’s consistent and timing-neutral, TWRR is the global standard for comparing fund managers and investment products.
Investment Return Calculation Methods Comparison
Based on the discussion above, here’s how each method behaves:
Total Return — shows overall gain but ignores timing.
Unrealized Return — focuses only on current holdings, not realized profits.
Arithmetic Average Return — simple mean, ignores compounding and time value.
MWRR — includes cash flow timing, reflects real investor experience.
TWRR — neutralizes cash flow impact, best for comparing performance.
Total Return | Unrealized Return | MWRR | TWRR | |
Unrealized Profit on Inventory | O | |||
Actual Earnings | O | O | ||
Considering Time Value | O | O | ||
Reflecting Investment Selection Skills | O | |||
Used to Calculate Investment Risk | O | |||
Can be used as a basis for comparison. | O |
Application areas of Return Calculation Methods
Total Return: When you just want a simple measure of how much you’ve earned overall.
Unrealized Return: When you only care about your current holdings, such as setting stop-loss or take-profit levels.
Money-Weighted Rate of Return: When tracking your financial goals — it checks whether your actual performance meets the internal rate of return needed to stay on plan.
Time-Weighted Rate of Return: When you want to compare your investment performance with others, with indexes, or to evaluate your risk-adjusted returns.
Understanding the difference between these methods changes how you see your portfolio.
The number itself doesn’t lie — but it tells a different truth depending on how you measure it.
And yes, you could calculate them all by hand… if you enjoy spreadsheets, formula tracing, and error-checking.
Or you can let Vision Money do the math.
It automatically calculates both MWRR and TWRR for all your accounts, using real prices, deposits, and withdrawals.
You’ll always know your true investment performance — clearly, accurately, and effortlessly.