Vision Money Getting Started Guide
Welcome to Vision Money!
We are excited to have you on board! Vision Money’s primary purpose is to provide clarity and confidence in your financial planning by allowing you to see how your decisions impact your financial future.
Introduction to the Vision Money Concept
Vision Money is a comprehensive financial planning and tracking tool. It is designed to help you visualize your financial goals and monitor your progress in achieving them. Vision Money uses a goal-based approach, where you can set and manage multiple financial objectives, including savings, spending, income, and investment goals.
The following chart represents our financial planning concept. Each piece of the conceptual diagram works together to give you a clear understanding of your financial situation.

Setting Financial Goals
Starting with your financial goals, you will set up each goal by defining key parameters like initial assets, savings targets, income expectations, and spending limits. Goals can be long-term or short-term, making them versatile for any financial situation.
Let’s take a look at a few example goals:

Income Goal: I have a one-time income (balance) of $10,000.
Spending Goal: I currently need $3,000 monthly to live on until I retire.
Retirement Goal: I want to retire in 20 years. I need $4000 a month to live comfortably.
College Education Goal: My child will attend college in 10 years. I estimate the need to be $40,000 per semester.
Spending Goal: I want to travel to Europe in 7 years. The trip will cost about $20,000.

Goal Evaluation
Once your goals are created, Vision Money evaluates their feasibility using a Target Return Rate. The platform uses modeling to predict whether the goals are achievable in the specified timeframe.
Looking at the Goal Achievement %, we can see how much of your income goes towards each goal. This is the Cost %. Using our example goals above, you can see that 40% of the income is allocated towards the Monthly Spending goal, 41% towards Retirement, 18% toward Education, and 1% towards the trip.
The Goal % column shows how much of the goal will be fulfilled based on your income. In this case,100% of the Monthly Spending goal can be reached, 100% of the Retirement goal can be reached, but only 72% of the Education goal can be funded, and none of the trip goal.

Adjusting Target Returns
")
You can adjust the rate of return to see how it will impact progress towards your goals. So, let’s say you increase the rate of return to 10% (from 2%). After recalculating, the system says your goals are now achievable. However, this higher return comes with more risk.
This exercise highlights an essential financial planning principle: balancing risk and reward. Vision Money helps you understand the trade-offs involved in investment decisions. The system can suggest adjusting other factors for users who prefer lower-risk investments, like reducing spending or extending timelines. This empowers users to create a balanced financial plan that suits their risk tolerance.
Note that there is also a Minimum Return option. This lets you see the minimum return amount you need to achieve your goals entirely.

You may see that an increased return amount will help you reach all of your goals. You can use that information to weigh your options. Do you need to change your investments, invest more, or even make a higher salary?
In the example goals we have been using, the Minimum Return calculates that we need a minimum of 7.12% return to reach our goals.
Prioritizing Goals
You should also recognize that not all goals are of equal importance. Vision Money allows you to prioritize your goals. This is useful for ensuring that your essential expenses are covered before focusing on savings or extra expenditures. This flexibility will enable you to adapt your plans as your circumstances change. By using goal prioritization, Vision Money helps you create a realistic and sustainable financial plan that aligns with your values and responsibilities.
You can manipulate the order of the goals by dragging a goal to a new position in the list. For example, you may want to prioritize your European vacation over your retirement savings. In that case, drag the trip goal above the retirement goal. You can then recalculate your goal achievement percentages.
In our example case study, moving our trip above our retirement goal changes things.

Now, we can fully reach our Monthly Spending, Trips, and Retirement. However, we can only realize 80% of the college education goal.
Setting Up Accounts
Bank Account: Current Balance of $17,000
Credit Card 1: Balance of -$2,150. Note that it is a negative amount because it is owed.
401k Account: Current balance of 45,345.
Fidelity Investment Account: Value of $10,312.78 with the following investments:
- AAPL (Apple Inc.), 10 shares, Current Price per share $180, Total Value $2180.70
- MSFT (Microsoft Corp.), 8 shares, Current Price per share $400, Total Value $3,130.08
- USGXX Money Market Fund: $5,000
IRA: Balance of 2,500.
Recording Transactions
Let’s look at some example transactions:
Spending: Groceries, $150 from Bank Account
Income: Salary, $5,000 to Bank Account
Trade: Buy 5 shares of AAPL (Apple Inc.), Total Cost $900
After entering all your transactions, you will see your Account listing updated with balances based on the transactions. You can look at the details of each account and see the actual transactions you entered. You will also see a chart depicting your Total Assets and Total Liabilities, which you can adjust for a specific period.

Investment Performance Tracking
Vision Money continuously tracks your investment performance and compares the actual return to the target return rate. This lets you see whether your actual returns align with your financial goals. Are they performing well enough, or are they underperforming? You can also see your actual Gain/Loss amount and all holding details.
From this perspective, you may need to adjust your investment strategy. Investigating the data in Vision Money further, you can gain insight into the reasons behind the performance gap, helping you make informed decisions about your investment portfolios.
Linking Goals to Actual Accounts
Vision Money allows you to tie your financial goals directly to your actual accounts to provide the most accurate evaluation of your goal achievement. This ensures that all calculations are based on your current “real-world” data.
You can select one or more accounts from the Goals Basic Settings page to link your accounts to your goals.
Continuing with our case study, let’s link the goals to all of our accounts.

After linking the goals to your accounts, you can reevaluate the goals against your actual data and see the current progress toward the goals.

We can see now that the system projected that we would achieve 80% of our College Education goal. However, based on our current data, we can reach 94%.
This improvement demonstrates how Vision Money can reveal positive financial trends that may not be immediately visible. Linking accounts also minimizes the risk of errors in manual data entry, providing users with a more reliable financial overview.
So why do we see a difference?
Vision Money helps us understand the factors influencing progress.

Looking at the data, we can see that our Target Assets were $27,613, but our Actual Assets were $75,549. This means that we achieved our target asset by 273.60%.
We can see that the reported income is lower than the goal (red), but the spending was much lower (green), just under 5% of our target.
We can also see that the current return % is -3.59%, and the goal was .28%, so it underperformed. So we can see that we have a positive Asset Achievement because of our frugal spending. If the Asset Achievement % is over 100, we can surely meet our goals.
This analysis is an invaluable tool for us to make informed financial decisions. Vision Money empowers you to adjust strategies and stay on course toward achieving your goals.
A Quick Tour of the App
First, let’s take a quick tour of the application.
After logging in, you will see the Dashboard, where you can see an overview of your finances, including the status of your goals, balance information, and income and spending amounts.
The application comes with sample data so you can see how it works. You can use this data to learn how the money flows through the application. Once you feel comfortable, you can simply delete the data and begin to configure the app with your own data.
There is a menu on the upper-left side of the app. Access it by clicking the icon. It provides quick access to the Dashboard, Goals, Budget, Settings, and other data settings.

You will notice a bell icon, 🔔 , in the upper-right corner of the Dashboard. If you have any new notifications, the icons will display
Click the icon to open the Notifications panel. Once you read the notifications, you can click x to delete each one.
- Along the bottom of the screen is a menu of commonly used features.
- Click Account to manage your accounts.
- Click Transaction to see a list of the latest recorded transactions and to add new ones.
- The Performance page shows your Account returns, gains, and losses.
- Lastly, the Report page allows you to run several reports on your data.
Each section on the Dashboard can be expanded and collapsed by clicking the arrow on the right.
It contains the following sections:
- Goal Status– Displays a summary of the defined goals. Click Goal Status Detail to see goal details.
- Historical Asset Balance– Displays a historical look at the asset balance of all accounts. The timeframe displayed is from the earliest transaction date to today.
- Monthly Income– A monthly look at income based on the transaction categories. Click the left and right arrows to see each month’s income.
- Monthly Spending– A monthly look at spending based on the transaction categories. Click the left and right arrows to see each month’s spending.
- Budget Notification– Notifications are displayed for monthly income or spending that exceeds the budget threshold.
- Investment Return Notification– Displays a comparison of the target annual return with the actuals based on the Return calculation start date defined in the Settings. The results of the comparison are displayed if they exceed the threshold setting.
- Bill/Income Notification– Based on updated transaction data, Bills and Income updates are displayed.
- Dividend Notification– Based on the held investment assets, if a particular asset has dividends, a dividend notification will be generated during data updates.
Now that you understand the Vision Money concept let’s dive into configuring the application with your data.
Let’s Get Started!
")
Create Your Account
Creating an account is simple. Enter your name and email address, then review and accept the Terms of Use and Privacy Policy. Click Continue.
Next, enter the password you wish to use. You will need to enter it twice. Then click Continue.
We will send you a verification email. Enter the Verification Code on the next screen, then click Continue. Your account creation is complete.
Sign In
To log in, enter your Email and Password.
Note: If biometrics are turned on on your device, click Biometric Sign In and complete the login using your chosen biometric feature.
If you have forgotten your password, click Forgot Password. The system will ask you for your email address and send you a link to reset your password. The email will contain a verification code. Once you enter the code, you will be prompted to enter a new password.
After successfully signing in, the Dashboard will be displayed.
Initial Setup
The Initial Wizard removes the application’s sample data and helps you quickly configure the application with your accounts.
Click the ≡ icon on the upper-left corner of any page on the app to open the menu. Select Initial Wizard.
The wizard guides you through the setup process. Click Next Step to move through each step of the setup process.
- Click Clear Sample Datato remove all existing sample data. You will receive confirmation when it is complete.
- Select Primary Currency– The selected primary currency is used for all calculations in the application. Click on the currency field, choose your currency, and then click OK. Click Next Step.
- Share Your Dreams(Create a Goal) – Vision Money helps you achieve your financial goals by tracking your income, spending, and investments while providing insights on whether you are on track to meet your goals. Enter your goals here. Initially, start with a straightforward goal.
Enter the Maturity Date of the goal. This is the date you want to achieve the goal. Then, enter the Target Amount you wish to accomplish in this timeframe.
Next, enter the Monthly Savings amount you will contribute to the goal and the Return Percentage the account earns.
- Add Account– Next, we will create an account. We recommend you create a Savings account to track your cash on hand. You can add more accounts at any time.
Give the account a Name and enter its balance.
- Add Income Transaction– Now, we will add an income transaction. This is just a simple single transaction to get started. More transactions and details will be added later.
The Transaction Date for this initial transaction will be the current date. Select a Category by clicking on the Category field. You can select one of the pre-defined categories or add a new one. Then, enter the Transaction Amount.
- Add Spending Transaction– Here, you will add a new spending transaction. This is just a simple single transaction to get you started.
The Transaction Date is the current date. Select a Category by clicking on the Category field. You can select one of the pre-defined categories or add a new one. Then, enter the Transaction Amount. A calculator is available if needed.
- Add Investment Account– Create an investment account using your historical data.
Enter the Investing Account name, the (Symbol) Holding Security, Holding Shares, and the Total Cost.
- Add Security Sold– Lastly, enter a security sell or trade transaction for the previously defined Investment Account.
Enter the number of shares sold and the total cost of the transaction.
- The Initial Wizard setup is now complete. Click Let’s Start – Speedy UI Navigation,and your data will be created.
Language and Currency Settings
Once your account is created, we recommend setting the Language and Currency settings. Proceed to the Settings page by clicking the ≡ icon and selecting Setting and Version from the menu.
Scroll down the page to the Primary Currency section. Click Edit. Select your preferred currency and click OK. You can update the Primary Currency decimals in the next section if needed.
Now scroll down to the Language section and click Edit. Select your desired language for the application’s interface.
Note: If you change the Language, you must close the program and log in again.
Goal Setting
Adding Goals
From the Dashboard, click the ≡ icon on the upper-left corner of any page and select My Goals. Next, click the gear icon in the upper-right corner of the My Goals page. You will see all the Goal settings. In the My Goals section, click Edit.
")
The Goal Listing is displayed.

Click + to add a new goal.
Goal Types
There are three types of goals you can create in Vision Money, Savings Goals, Income Goals, and Spending Goals.
Saving Goals – Saving Goals are goals that relate to money I want to save for the future. This includes things like a vacation, etc.
Income Goal – Income Goals are for goals that relate to money coming in. This includes things like your salary, initial balances, bonus, etc.
Spending Goals – Spending Goals are for things that you will pay for in the future. For example, Retirement, College Education, House Purchase, monthly living expenses, etc.
The predefined goals include the following:
College Education – Planning to save for college.
Retirement – Planning to save money for retirement.
Home Purchase – Planning to purchase a home in the future.
Use the Income and Spending goals for any other goals you want to create.
Income – Planning to save a portion of income. This could be how much you want to save each month.
Spending – Planning for a specified spend amount. This could be a future purchase, travel, etc.
After selecting the goal type, you will enter its details.
College Education
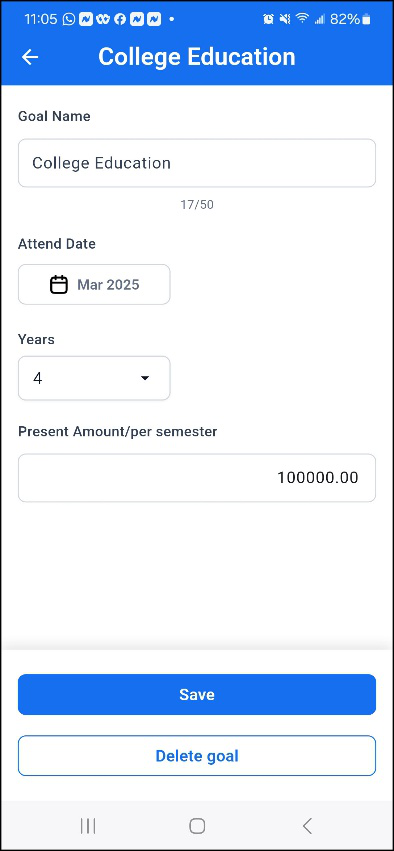
- Goal Name: Recognizable Goal name.
- Attend Date: Start date of attendance.
- Number of years: Number of years to attend.
- Cost per semester: Approximate cost per semester.
Home Purchase
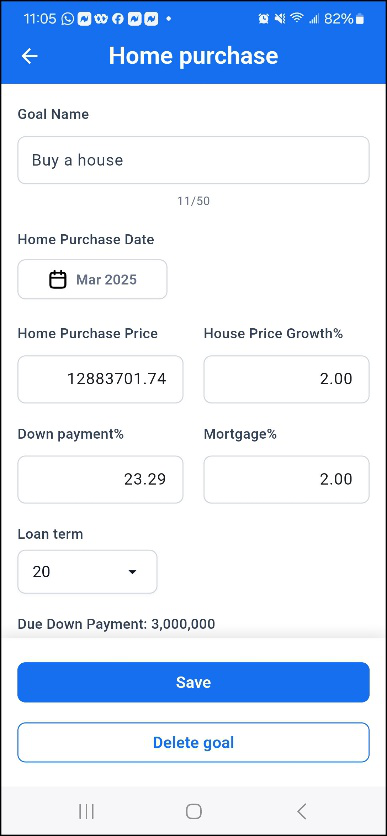
- Goal Name: Recognizable Goal name.
- Home Purchase Date: Date to buy home.
- Home Purchase Price: Cost of house.
- Down Payment: Down payment amount.
- Mortgage%: Mortgage Interest Rate
- Loan Term: Loan number of years
- Down payment due date: Date the down payment will be needed.
Retirement
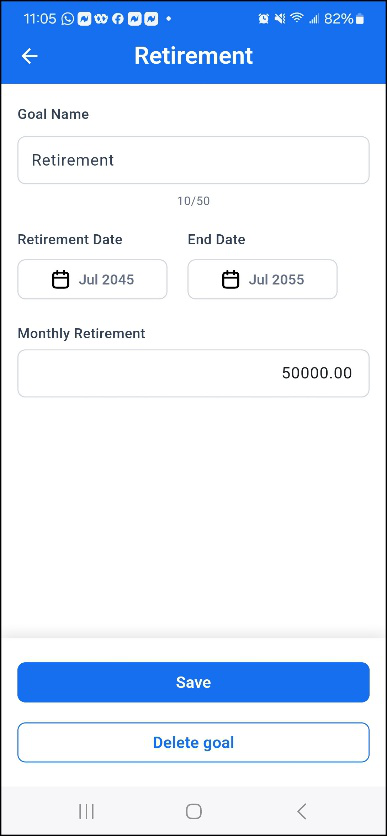
- Goal Name: Recognizable Goal name.
- Retirement Date: Start/End Date to retire. The End date should cover your approximate life span.
- Monthly Retirement: The amount you will need to live on each month.
Click Save when you are done setting up each goal.
Goal Priority
You can change the priority of any goal by dragging the goal to a new position in the list. To move it, press and hold the goal, then drag it to where you want to prioritize it in the list.
My Goals
Once you have entered your goals, you will see a summary of those goals on the My Goals page. You will see, based on your current income and assets, if your goals are achievable and how much can be allocated to achieve each goal. This forecast is based on the Target Annual Return %.

Target Return
Goal Achievement is calculated based on the Target Return percentage. You can enter a value of the current Return % and click Calculate. The calculation considers the status of each goal’s achievement and future cash balances based on this return value. You can review the Goal Achievement % to see if your goals are achievable and the allocation of each.
Minimal Required Return
Clicking on Minimum Return will calculate the minimum annual return you need to achieve all of your goals. This automatically updates the Goal Achievement % based on the minimum calculated return.
Goal Achievement %
The Goal Achievement percentage breaks down your goals (based on their priority) and tells you what percentage of each goal can be achieved based on the income, assets, and specified Target Return.
The Cost % column tells you how much of your income and assets it will take to fund each goal. The Target % column tells you how much of the goal is achievable at this rate of return. Lastly, the Current % column tells you where you are currently on target to reach based on your current situation.
Accounts
Click on the Account icon at the bottom of the page. The Account page lists all of your account balances and your Asset/Liability history.
Creating Accounts (Bank, Stocks, Mortgage, CC)
From the Account page, click + in the upper right-hand corner of the page to add a new account.
Enter the following information about each account:
- Account Name: The name of the account.
- Initial Balance Date: The date the account was created or the date you will track this account transactions from.
- Add Initial Balance: The initial balance of the account on the date you will begin tracking this account.
- Add Initial Positions: If this account is an investment account, you can add each holding in the account by entering the Security Symbol, number of shares, and total value.
")
Click on any account in the list to view its details. Click Edit Account to modify any parts of the account information. From the Edit page, click Delete account to remove it from the system.
Transactions
Click on the Transaction icon at the bottom of the page. The Transaction page lists all of your account transactions. The transactions can be filtered to display for the past day (1d), past 7 days (7d), past 30 days (30d) or past 12 months (12m). Click the time period you wish to see transactions for.
The Transaction list can be further be filtered on the type of transaction, Account, Category, or Tag. Click the Filters button and select the specific filters.
Add Transactions (Spending, Income, Trade)
Click + in the upper right-hand corner of the page to add a new transaction. Select the type of transaction at the top of the Add Transaction page (Spending, Income, Trade).
Spending Transaction
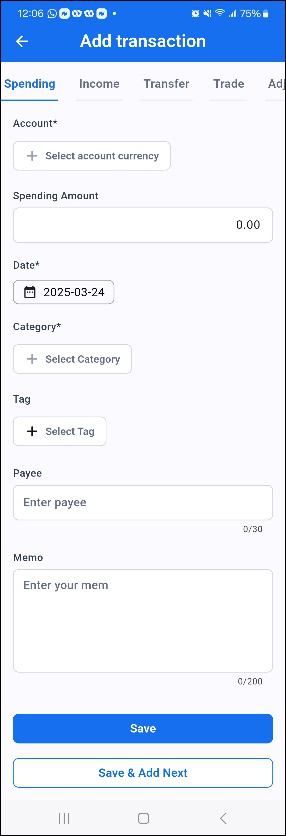
- Account: Select the account the money came from.
- Spending Amount: Enter the transaction amount.
- Date: Enter the transaction date.
- Category: Select a category for the transaction.
- Tag: Optionally select a tag for the transaction.
- Payee: Enter the transaction payee.
- Memo: Optionally enter a memo about the transaction.
Income Transaction
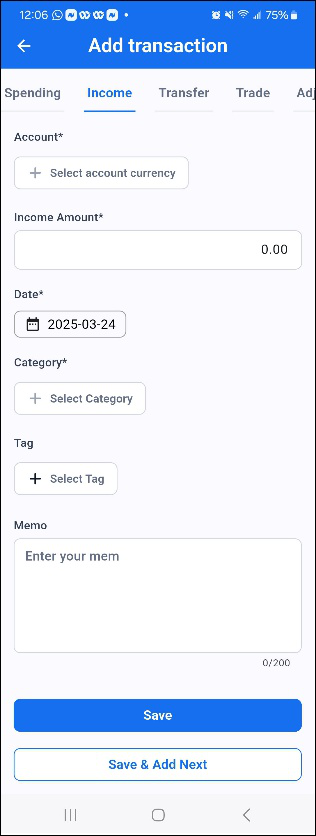
- Account: Select the account the money came from.
- Income Amount: Enter the transaction amount.
- Date: Enter the transaction date.
- Category: Select a category for the transaction.
- Tag: Optionally select a tag for the transaction.
- Memo: Optionally enter a memo about the transaction.
Trade Transaction
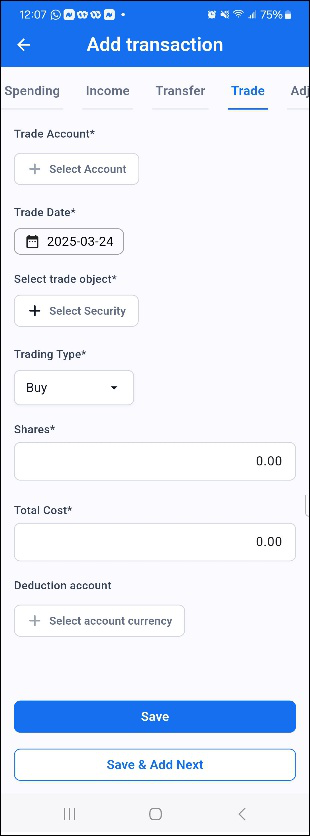
- Trade Account: Select the trade account for the transaction.
- Trade Date: Enter the trade date.
- Trade Object: Enter the Security involved in the transaction.
- Trading Type: Enter the transaction type (Buy, Sell, Dividend, etc.)
- Shares: Enter the number of shares for the transaction.
- Total Cost: Enter the total amount of the transaction.
- Deduction account: Enter the debit account for securities purchases and the remittance account for securities sales.
Click on any transaction in the list to edit it. From the Edit page, click Delete account to remove it from the system.
Please note that this is just an introduction to three transaction types. Refer to the User Guide for detailed information on all transaction types.
Investment
Vision Money has an investment feature available for upgraded accounts. It consolidates all relevant information related to your investments, providing a comprehensive view of your portfolio’s performance.
This includes key metrics such as the time-weighted rate of return, realized gains and losses, unrealized gains and losses, dividend income, comparisons with market returns, unrealized return, total investment value, and other important data.
You can see your Investment metrics by clicking the Performance icon at the bottom of the Dashboard.
Comparing Your Target Return versus the Actual Return
You can compare your actual returns against your target returns, which will provide valuable insights into your investment’s performance.
At the top of the Performance page, you can filter the data to a specific time period by selecting All, 12m (past year), 30d (past 30 days), 7d (past 7 days), or by clicking Dates and choosing a pre-defined or custom date period. Once selected, all information on the Performance page will be for the selected date period.
You can set their target annual return, represented by a yellow line in the chart. The green line is the Actual investment return. This chart depicts the cumulative return rate necessary to meet the target return by a specified date. Comparing the actual return to the target return provides a clear view of whether the investment has achieved its intended goals.

The Performance page also features a Gain/Loss section, which provides an overview of your Realized Investment Gains and Losses, Dividend Income, as well as Unrealized Gains and Losses.
Holding Details
The holding details section presents comprehensive information about individual securities in your portfolio. This includes data on the number of shares, current market price, gain/loss, market value, and allocation percentage. Below this section, you will find a detailed view of your investment accounts, displaying the actual total return percentage.
Goal Achievement
Vision Money allows you to track your performance against your actual account balance. Once you link your goals to your accounts, you will be able to compare your estimated target assets with the actual assets calculated from your account information.
Asset Achievement represents the progress of reaching your target assets. It can be broken down into four parts: Income, Spending, Investment, and Net Transfer, which helps you understand the factors that contributed most to your asset growth or decline.
Asset Achievement%
On the My Goals page, the Asset Achievement Analysis section indicates your progress and identifies potential factors that may be impacting your achievement.

First, click on the View Target Comparison Chart. Here, you will find a chart comparing the Target and Actual returns. A picture is often said to speak a thousand words.
Next, examine the Asset Achievement percentage. If this percentage is at least 100, you are doing well and achieving your goals.
You can compare the Actual Assets vs. your Target Assets. If the actual is larger than the target, you are doing better than initially expected. And the opposite is also true. If the Asset Achievement % is under 90% and/or the Target Assets are larger than the Actual Assets, you should sit down and figure out why.
Comparing Current vs Goal
Look at the asset details. Initially, you see the Items and the current value. But this list is scrollable. Scroll to the right to see the Goal and Achievement % columns.
This table provides a summary of your financial information, including income, Spending, and Transfers. Now, you can compare the Current vs. Goals to see where you stand.
From this list, what is different (target vs. actual)? Is it the spending? Did you spend more than initially thought? Why? Did you have more or less income than initially anticipated? Why? These are things you can review to determine what might be causing a difference and what you can improve upon.
Reports
Click on the Report icon at the bottom of the page. There are many different types of reports available.
All reports can be filtered to display the selected information for the past day, past 30 days (30d), the past 12 months (12m), or All. Click the period you wish to see the report for.
Reports can also be filtered further by clicking the Report option. You can choose the Chart type, specific date period, categories, accounts, and Tags.
Spending
The Spending report shows how much you have spent.

Income
The Income report shows all of your income transactions recorded.

Asset
The Asset report shows the total amount you have spent.

Liability
The Liability report show all of your liabilities.
